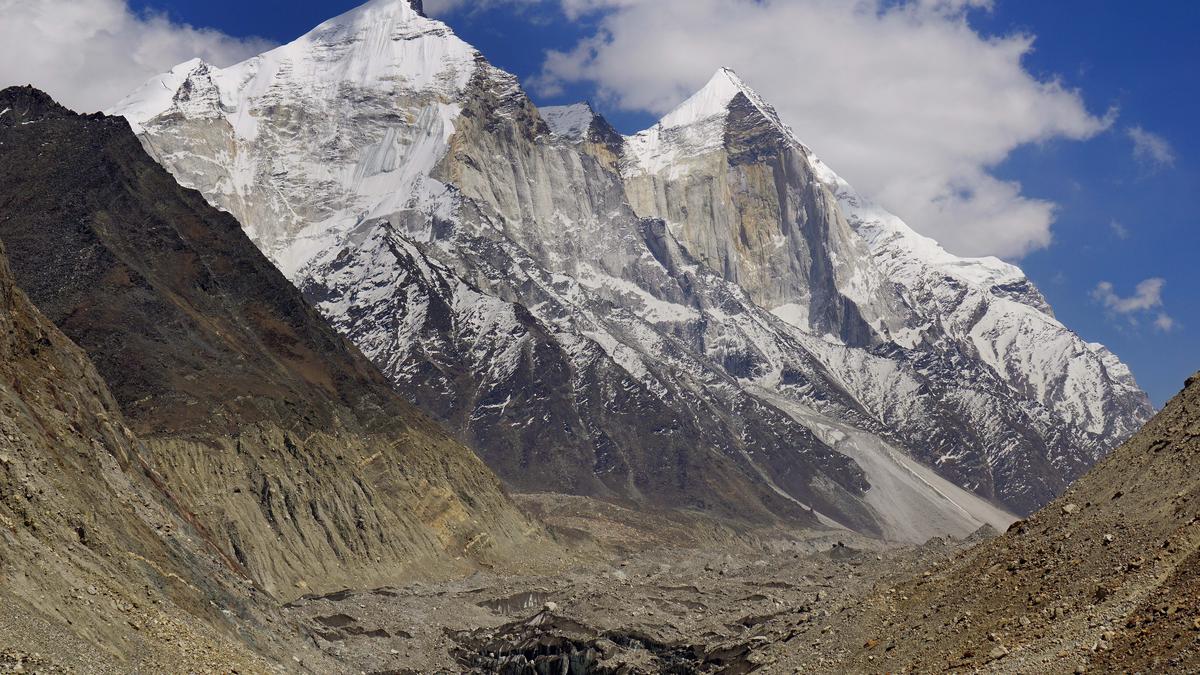
Picture shows Gaumukh, snout of the Gangotri glacier, surrounded by the Bhagirathi peaks of Garhwal Himalayas, at an altitude of over 4255 metres.
| Photo Credit: Vidya Venkat
The story so far:
A recent study has reconstructed the long-term discharge flow of the Gangotri Glacier System (GGS), the source of the upper Ganga basin which contributes to the waters of the Bhagirathi river in the central Himalayas. In the wake of climate change, glaciologists the world over have been studying the impact of glacier melt.
Why is the GGS significant?
The snow and ice reserves of the Hindu Kush Himalaya (HKH) are critical sources of water to sustain major rivers like the Indus, Ganga, and Brahmaputra. Significant climatic changes, however, have been observed in recent decades in the region, altering the cryosphere and the hydrological cycle. This has meant a change in the dynamics of glacier-fed hydrological systems, accelerating glacial retreat and shifting seasonal discharge patterns. Modelling studies, or theoretical assessments of these changes, are a popular approach among scientists to assess these changes though most of such studies have focussed on large catchments from the rivers mentioned earlier. Given their size, however, assessing river flow and delineating the contribution of snow melt and precipitation is challenging. It is easier to estimate this in relatively smaller systems such as the GGS and this is why it is a popular choice among hydrologists and climate scientists. That said, long-term discharge analysis, evolution of meltwater contribution and understanding the climatic drivers affecting GGS are still lacking. The current study, ‘Hydrological Contributions of Snow and Glacier Melt from the Gangotri Glacier System and Their Climatic Controls Since 1980’, led by researchers at the Indian Institute of Technology, Indore, the Universities of Utah and Dayton in the U.S. and the Kathmandu-based International Centre for Integrated Mountain Development, attempts to fill the gap. The study appears in the Journal of the Indian Society of Remote Sensing.

What did the study find?
The study reconstructed the long-term discharge trend of the GGS by combing a high-resolution glacio-hydrological model, called Spatial Processes in Hydrology (SPHY). This simulates terrestrial water balance processes, such as rainfall-runoff, evapotranspiration, and cryospheric processes. This is combined with the Indian Monsoon Data Assimilation and Analysis (IMDAA) dataset spanning 1980–2020. The latter is a re-analysis dataset — it provides a consistent and comprehensive history of the atmosphere, built by blending observational data with a numerical weather prediction model. Their analysis finds that maximum GGS discharge occurs during the summer months, with a peak in July at 129 cubic metre per second. The mean annual GGS discharge was estimated as 28±1.9 m3 /s, with the major contribution from snow melt (64%), followed by glacier melt (21%), rainfall-runoff (11%) and base flow (4%) over 1980–2020. A decadal discharge analysis, their study found, showed a shift in the discharge peak from August to July post-1990, which they attributed to decreased winter precipitation and enhanced melting in early summer.

The mean, decadal GGS discharge showed the highest volumetric increase of 7.8% from 1991–2000 to 2001–2010. While the mean annual temperature increased, no significant trend was observed in mean annual precipitation or glacier melt. Despite the warming, snow melt declined, mainly due to a decreasing trend in mean snow cover area, whereas rainfall-runoff and base flow increased over GGS during 1980–2020. Statistical analysis revealed that the mean annual discharge of GGS is mainly controlled by summer precipitation, followed by winter temperature.
Which glaciers make up the GGS?
The study area of the GGS comprises the glaciers Meru (7 km2), Raktavaran (30 km2), Chaturangi (75 km2) and the largest glacier Gangotri (140 km2). The GGS covers an area of 549 square km (km2) spanning an elevation range between 3,767 metres and 7,072 metres. About 48% of the GGS is glacierised. The GGS receives precipitation from the western disturbances during winter (October to April) and from the Indian summer monsoon during summer (May to September). The average seasonal rainfall (May to October) is around 260 mm, with an average mean temperature of 9.4°C for the period 2000–2003.

What are the implications of the findings?
Rainfall run-off and base flow have exhibited increasing trends on GGS, suggesting warming-induced hydrological changes. This year the summer monsoon has been particularly intense in north India with nearly 25% more rain than usual from June to August. There have been several instances of intense floods in Uttarakhand, Jammu and Himachal Pradesh often prompting State authorities to label them – without a scientific basis – as ‘cloudburst,’ despite the lack of appropriate instruments or satellite imagery to justify this. A cloudburst is when over 10 cm of rainfall is reported in an hour over an area less than 30 square km. While climate changes don’t rule out the possibility of more cloudbursts, studies such as these underscore the urgent need for continued field monitoring and modelling efforts to enhance water resource management strategies in glacier-fed river basins.
Published – August 31, 2025 02:27 am IST
