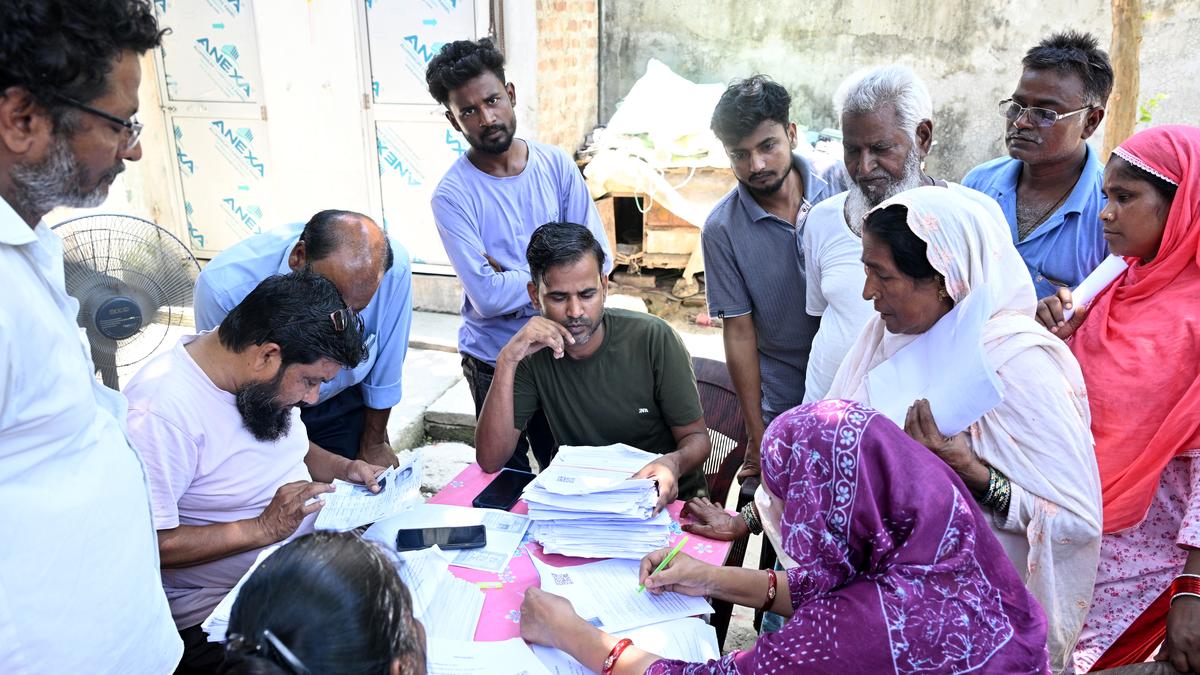
A Booth Level Officer (BLO) checks documents during Special Intensive Revision at Jogbani, a municipal council area of Araria District in Bihar
| Photo Credit: SHASHI SHEKHAR KASHYAP
A granular look at deletions in the special intensive revision (SIR) carried out by the Election Commission (EC) in Bihar shows women electors significantly outnumbered men in the “permanently shifted” category. This trend was more pronounced among younger voters below the age of 40.
Following the Supreme Court’s directive, the EC released the full list of close to 65 lakh deleted voters with reasons. In a previous Datapoint in The Hindu, we found the SIR resulted in deletions of around 7 lakh more female electors compared to the rolls prepared as on January 1, 2025.

We repeated this exercise to identify constituencies with the most deletions by comparing August SIR rolls with pending enrolments released by the Bihar Chief Electoral Officer in mid-July 2025. The table below shows the top nine Assembly constituencies with the most deletions. It also mentions the number of electors deleted and exclusion reasons as a share, according to data shared on August 17.
In mobile, scroll sideways to view all columns
We had conjectured that higher deletions among women were due to higher illiteracy rates in Bihar and the inability to fill enumeration forms. But we found no correlation between illiteracy and exclusion rates in Bihar’s districts.
We went on to extract the Electors Photo Identity Card (EPIC) IDs and the reasons for the deletions of all electors for these top nine ACs. Only the top nine ACs were considered, as the EC has maintained the whole set of data in image PDFs, making it onerous to extract full information.

After parsing this data, we found starker patterns in deletions among men and women across certain “reason” and “age cohort” categories.
The table below looks at gender-wise and reason-wise patterns among the exclusions in the top nine ACs. While there was barely any gender-difference among exclusions pertaining to “not found”, “enrolled elsewhere as well” and “deceased” voters, there was a stark difference in the “permanently shifted” category. About 62.6% of those who were excluded for this reason were women compared to 37.4% who were men.
In mobile, scroll sideways to view all columns
When age cohorts were included in the analysis, we found an even more distinct pattern. The table shows the gender-wise, reason-wise, and age-wise patterns among the exclusions in the top nine ACs
In mobile, scroll sideways to view all columns
Among the 18-29 and 30-49 age cohorts, women outnumbered men three to one and two to one, respectively, in the list of exclusions under the “permanently shifted” category, with no such noticeable differences among other categories. Which leads us to the question, is the higher deletion among women due to the exclusion of younger, married women who have shifted to other States?
Data from the 2011 Census offers us pointers. The table shows gender-wise number of people who migrated out of Bihar according to 2011 census
In mobile, scroll sideways to view all columns
Nearly 17.7 lakh women had shifted out of Bihar due to marriage, in comparison to just around 43,000 men who had done so. In contrast, 21.2 lakh men had shifted out of Bihar due to work. In comparison, just around 1.5 lakh women had done so. This led to migrant men (38.5 lakh) outnumbering women (36.02 lakh) by around 2.5 lakh overall from the State. This gap would have clearly increased in the last 14 years, as we know that male migration for work has only increased further.
That leaves the question — why have more migrant women been excluded from the SIR electoral rolls? Is this because male electors who migrated over the years were already excluded in the summary revisions in the previous years? Also, what are the implications of excluding these migrants without making sure that they are enrolled as voters in other States? Will this lead to their disenfranchisement?
The data for the tables were sourced from the Election Commission, ceoelection.bihar.gov.in and the 2011 Census. Data for gender and reasons were scraped and converted from image PDF to spreadsheets using OCR software
Published – August 21, 2025 05:18 pm IST