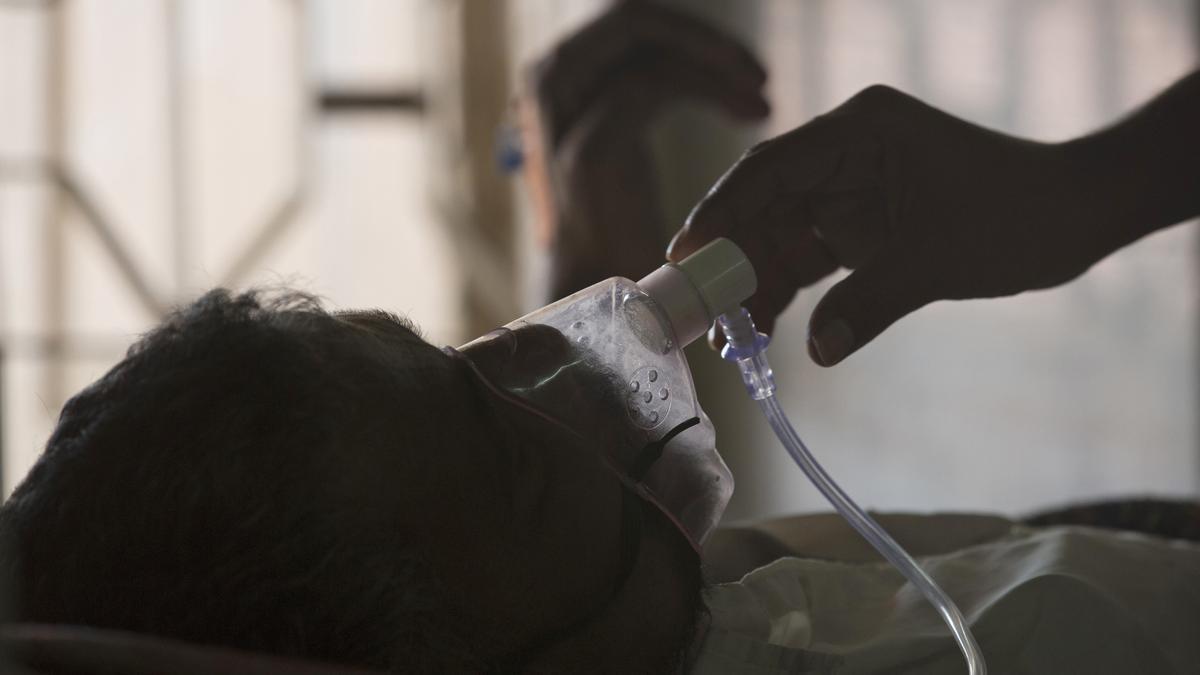
A relative adjusts the oxygen mask of a tuberculosis patient at a TB hospital on World Tuberculosis Day in Hyderabad, India, March 24, 2018.
| Photo Credit: MAHESH KUMAR A.
A recent report by the Resource Group for Education and Advocacy for Community Health (REACH) highlights efforts to address tuberculosis (TB) among migrants in Tamil Nadu. Several challenges, including loss to follow-up, occupational risks in hazardous environments, and lack of official documentation, hinder diagnosis and treatment for this vulnerable group.

In collaboration with the National TB Elimination Programme (NTEP) and with support from the STOP TB Partnership, REACH implemented a pilot intervention in four Tamil Nadu districts — Chennai, Coimbatore, Kancheepuram, and Vellore — from July 2023 to December 2024.
Chart 1 shows the age-wise split of TB who were screened in the first four districts of Tamil Nadu
Charts appear incomplete? Click to remove AMP mode.
As part of the project, people with TB at selected health facilities were screened to identify migrants among them. Of the 11,564 TB patients screened, the majority were aged 15–59 years (77) and male (66%).
Chart 2 shows the gender-wise split of those with TB of those who were screened
Chart 3 shows the share of migrants among those who were screened in the four Tamil Nadu districts
Significantly, 36.6% were migrants, with 2.2% of these cases being drug-resistant TB. Based on drug resistance status, additional nutritional support, such as enhanced dry rations, was provided.
Chart 4 shows the migrants categorised by location
Migrants were categorised by their location. Over 62% were identified as those transferring out of the intervention districts to other districts or States, while about 22% resided in another district but came to the intervention districts for medication.
Chart 5 shows the health-related vulnerabilities of the migrants who were screened
A co-morbidity study among these migrants revealed that 29% were undernourished, 27% had diabetes, and 25% consumed alcohol.
Chart 6 maps inter-State migrant TB cases
Mapping inter-State migrant TB cases showed that most transfers occurred in West Bengal, followed by Andhra Pradesh and Jharkhand.
Chart 7 depicts intra-State TB migrants.
Source: Resource Group for Education and Advocacy for Community Health
Also read: Over 78% of top paid H1B applicants were from India
Published – December 31, 2024 08:00 am IST
